In the world of safety-critical systems, understanding the timing behavior of your system is critical for:
- Meeting real-time deadlines
- Debugging scheduling issues
- Validating runtime behavior against design-time expectations
This is why MotionWise Schedule includes powerful tools for visualizing and analyzing scheduling and computation chains—ensuring planned execution aligns with runtime performance. With MotionWise Schedule Visualization tools, you gain a clear, interactive view into your system’s temporal behavior, empowering you to build safer, more reliable software.
What Is Schedule Visualization?
Schedule Visualization is the process of graphically representing the schedule of software components across different CPU cores, microcontrollers and microprocessors. It helps developers, testers, and integrators understand how tasks are distributed, timed, and executed in their target system.
At the heart of this capability is the Schedule Viewer, a lightweight, HTML-based tool that requires no installation—just open it in your browser.
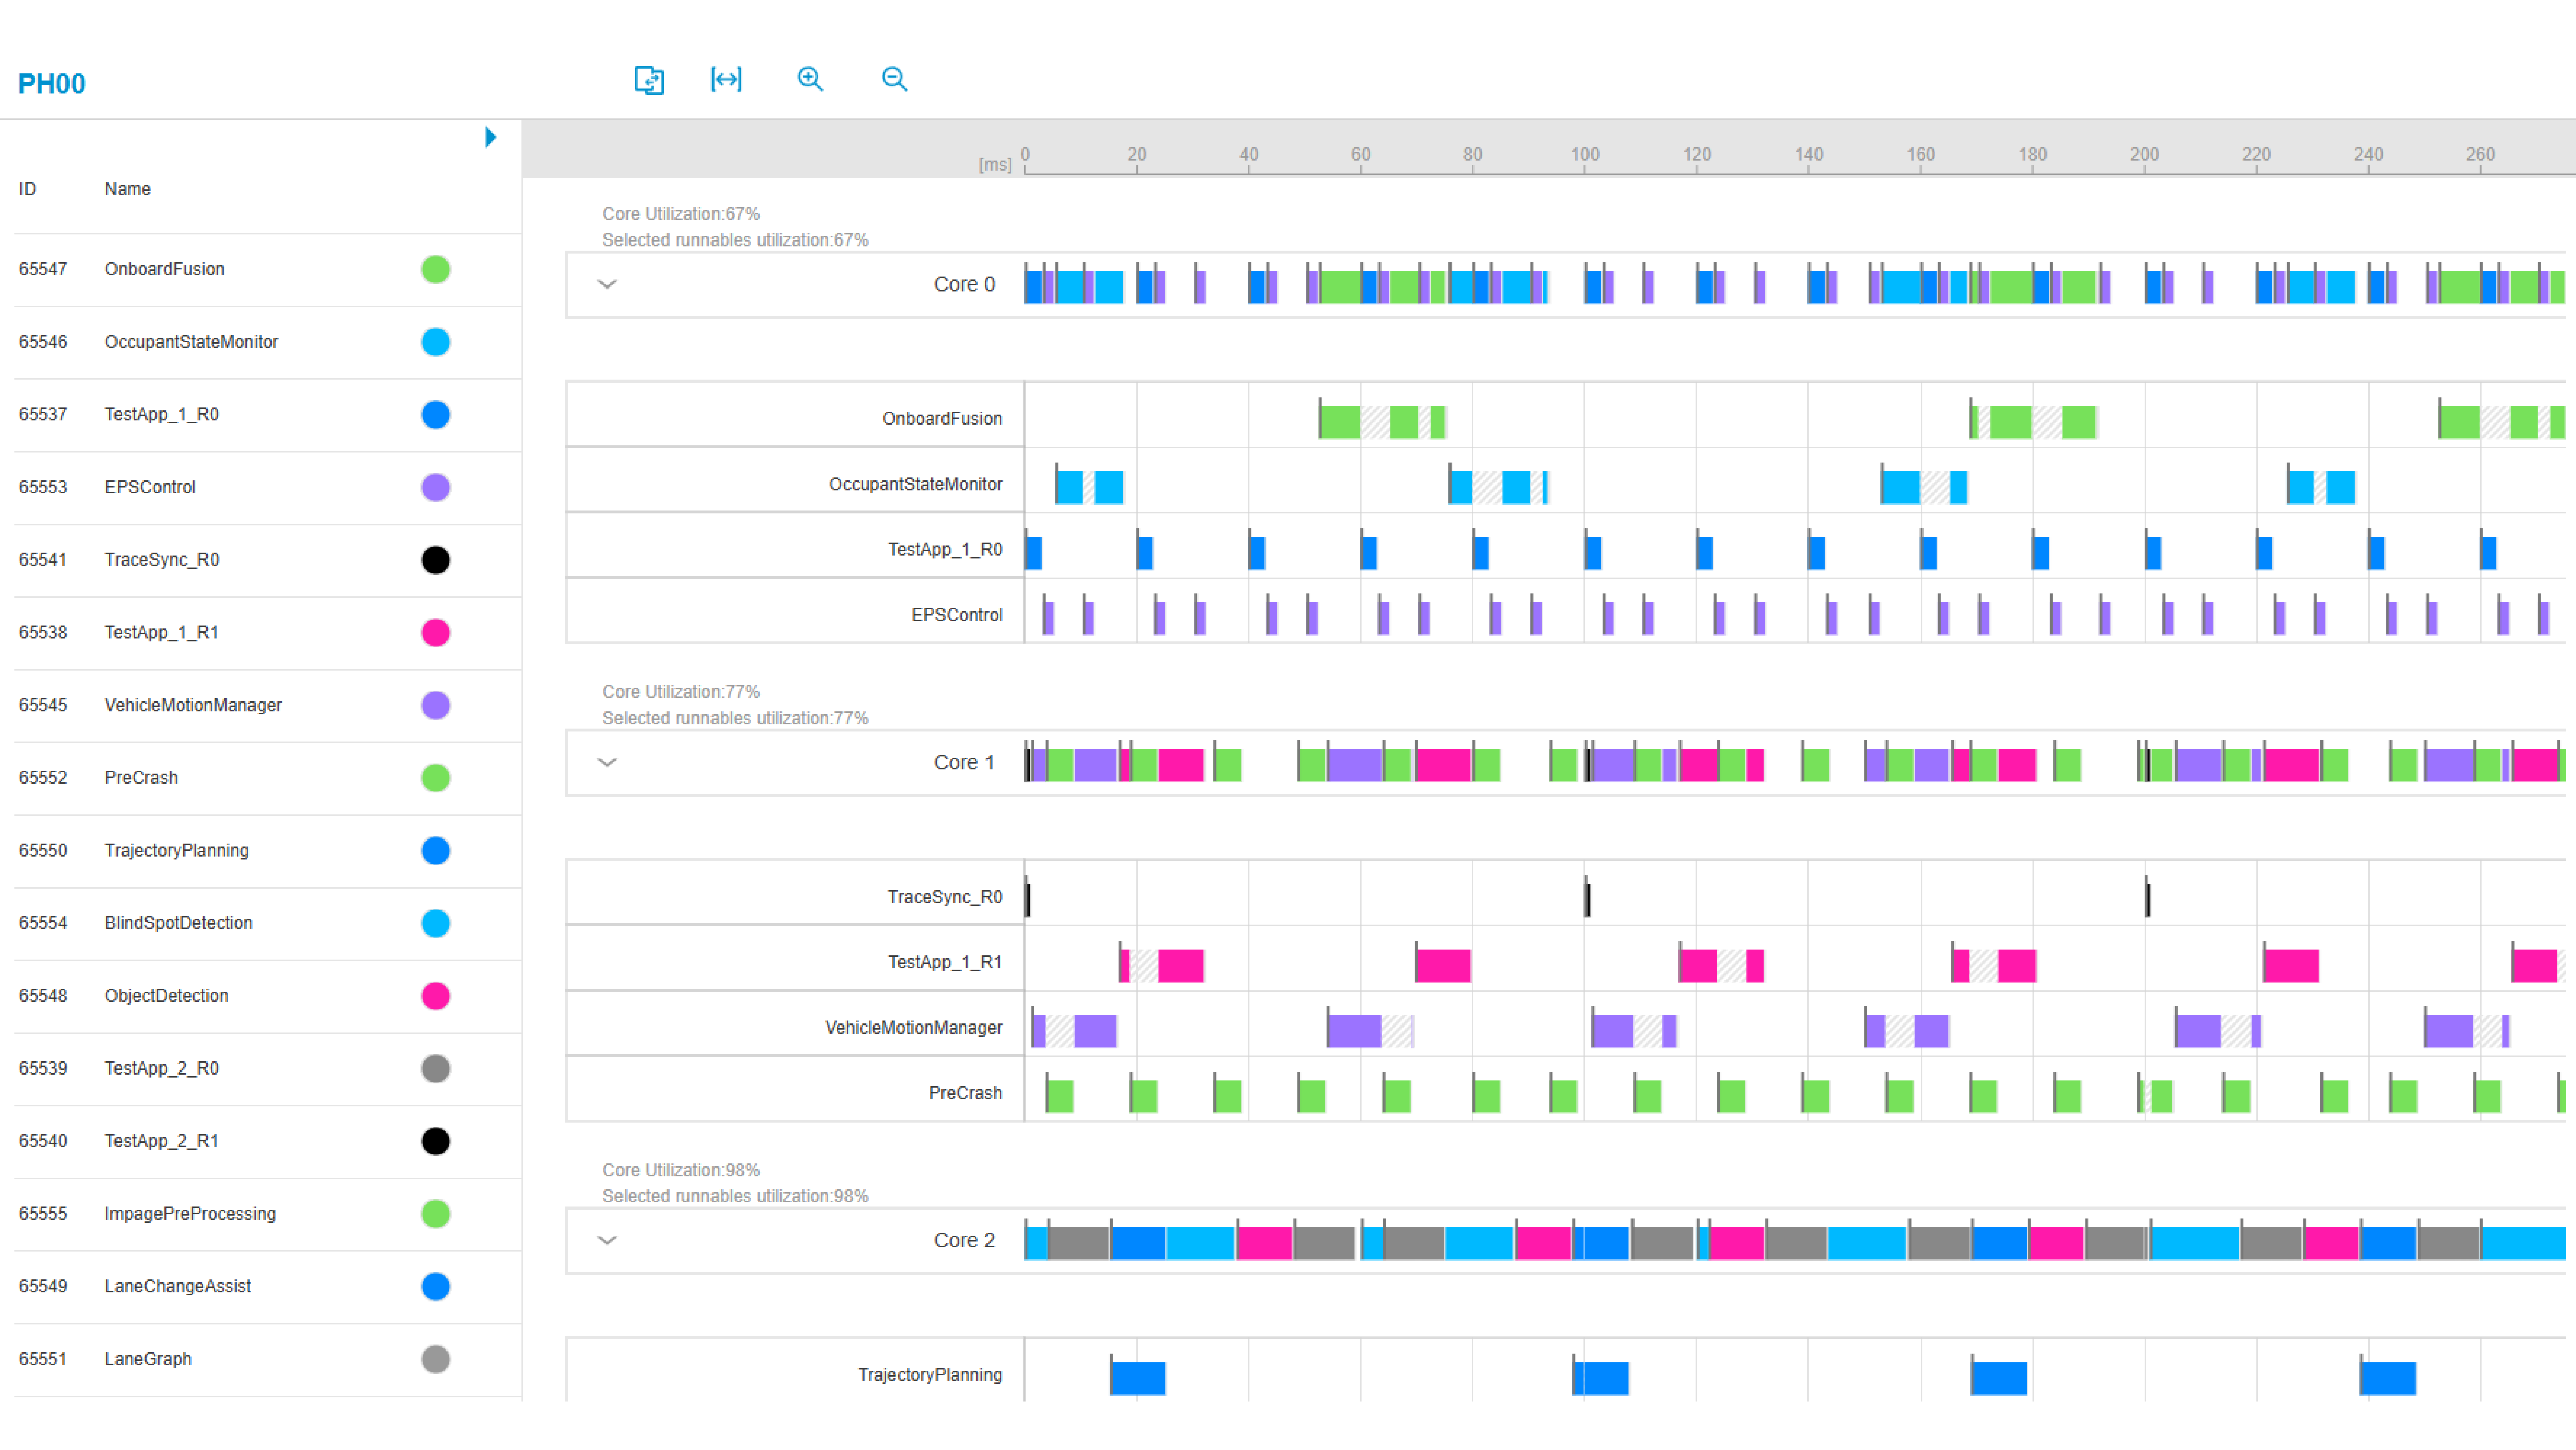
Figure 1: Schedule Visualization tooling in MotionWise Schedule
Key Features of the Schedule Viewer
- Zoom & Pan: Navigate the timeline with ease using zoom icons, keyboard shortcuts, or mouse dragging.
- Measuring Tool: Measure time intervals between events with a simple click-and-drag ruler.
- Runnable List & Filtering: View all runnables, sort them by properties, and choose which to display.
- Color Customization: Assign colors to individual runnables or auto-assign them for clarity.
- Runtime Data Overlay: Compare planned vs. actual execution using imported runtime JSON data.
- Hyperperiod Navigation: Step through multiple hyperperiods using intuitive forward/backward controls.
- Interactive Details: Click on any slot to reveal detailed runnable, sequence, or activity information.
- Available for Classic AUTOSAR based microcontrollers, Linux or QNX based microprocessors
Computation Chain Visualization
In our previous article, MotionWise Global Scheduler: Tackling the Challenges of Modern SDVs, we discussed the importance of end-to-end latencies across multiple hardware units: Vehicle functions are realized through multiple interdependent application threads and processes that form dependency chains. In our products, we call them Computation Chains. The Computation Chain Viewer complements the Schedule Viewer by providing:
- A focused look at defined chains and their instances
- Zooming, panning, and timing measurement tools
- Drill-down analysis of individual chain instances
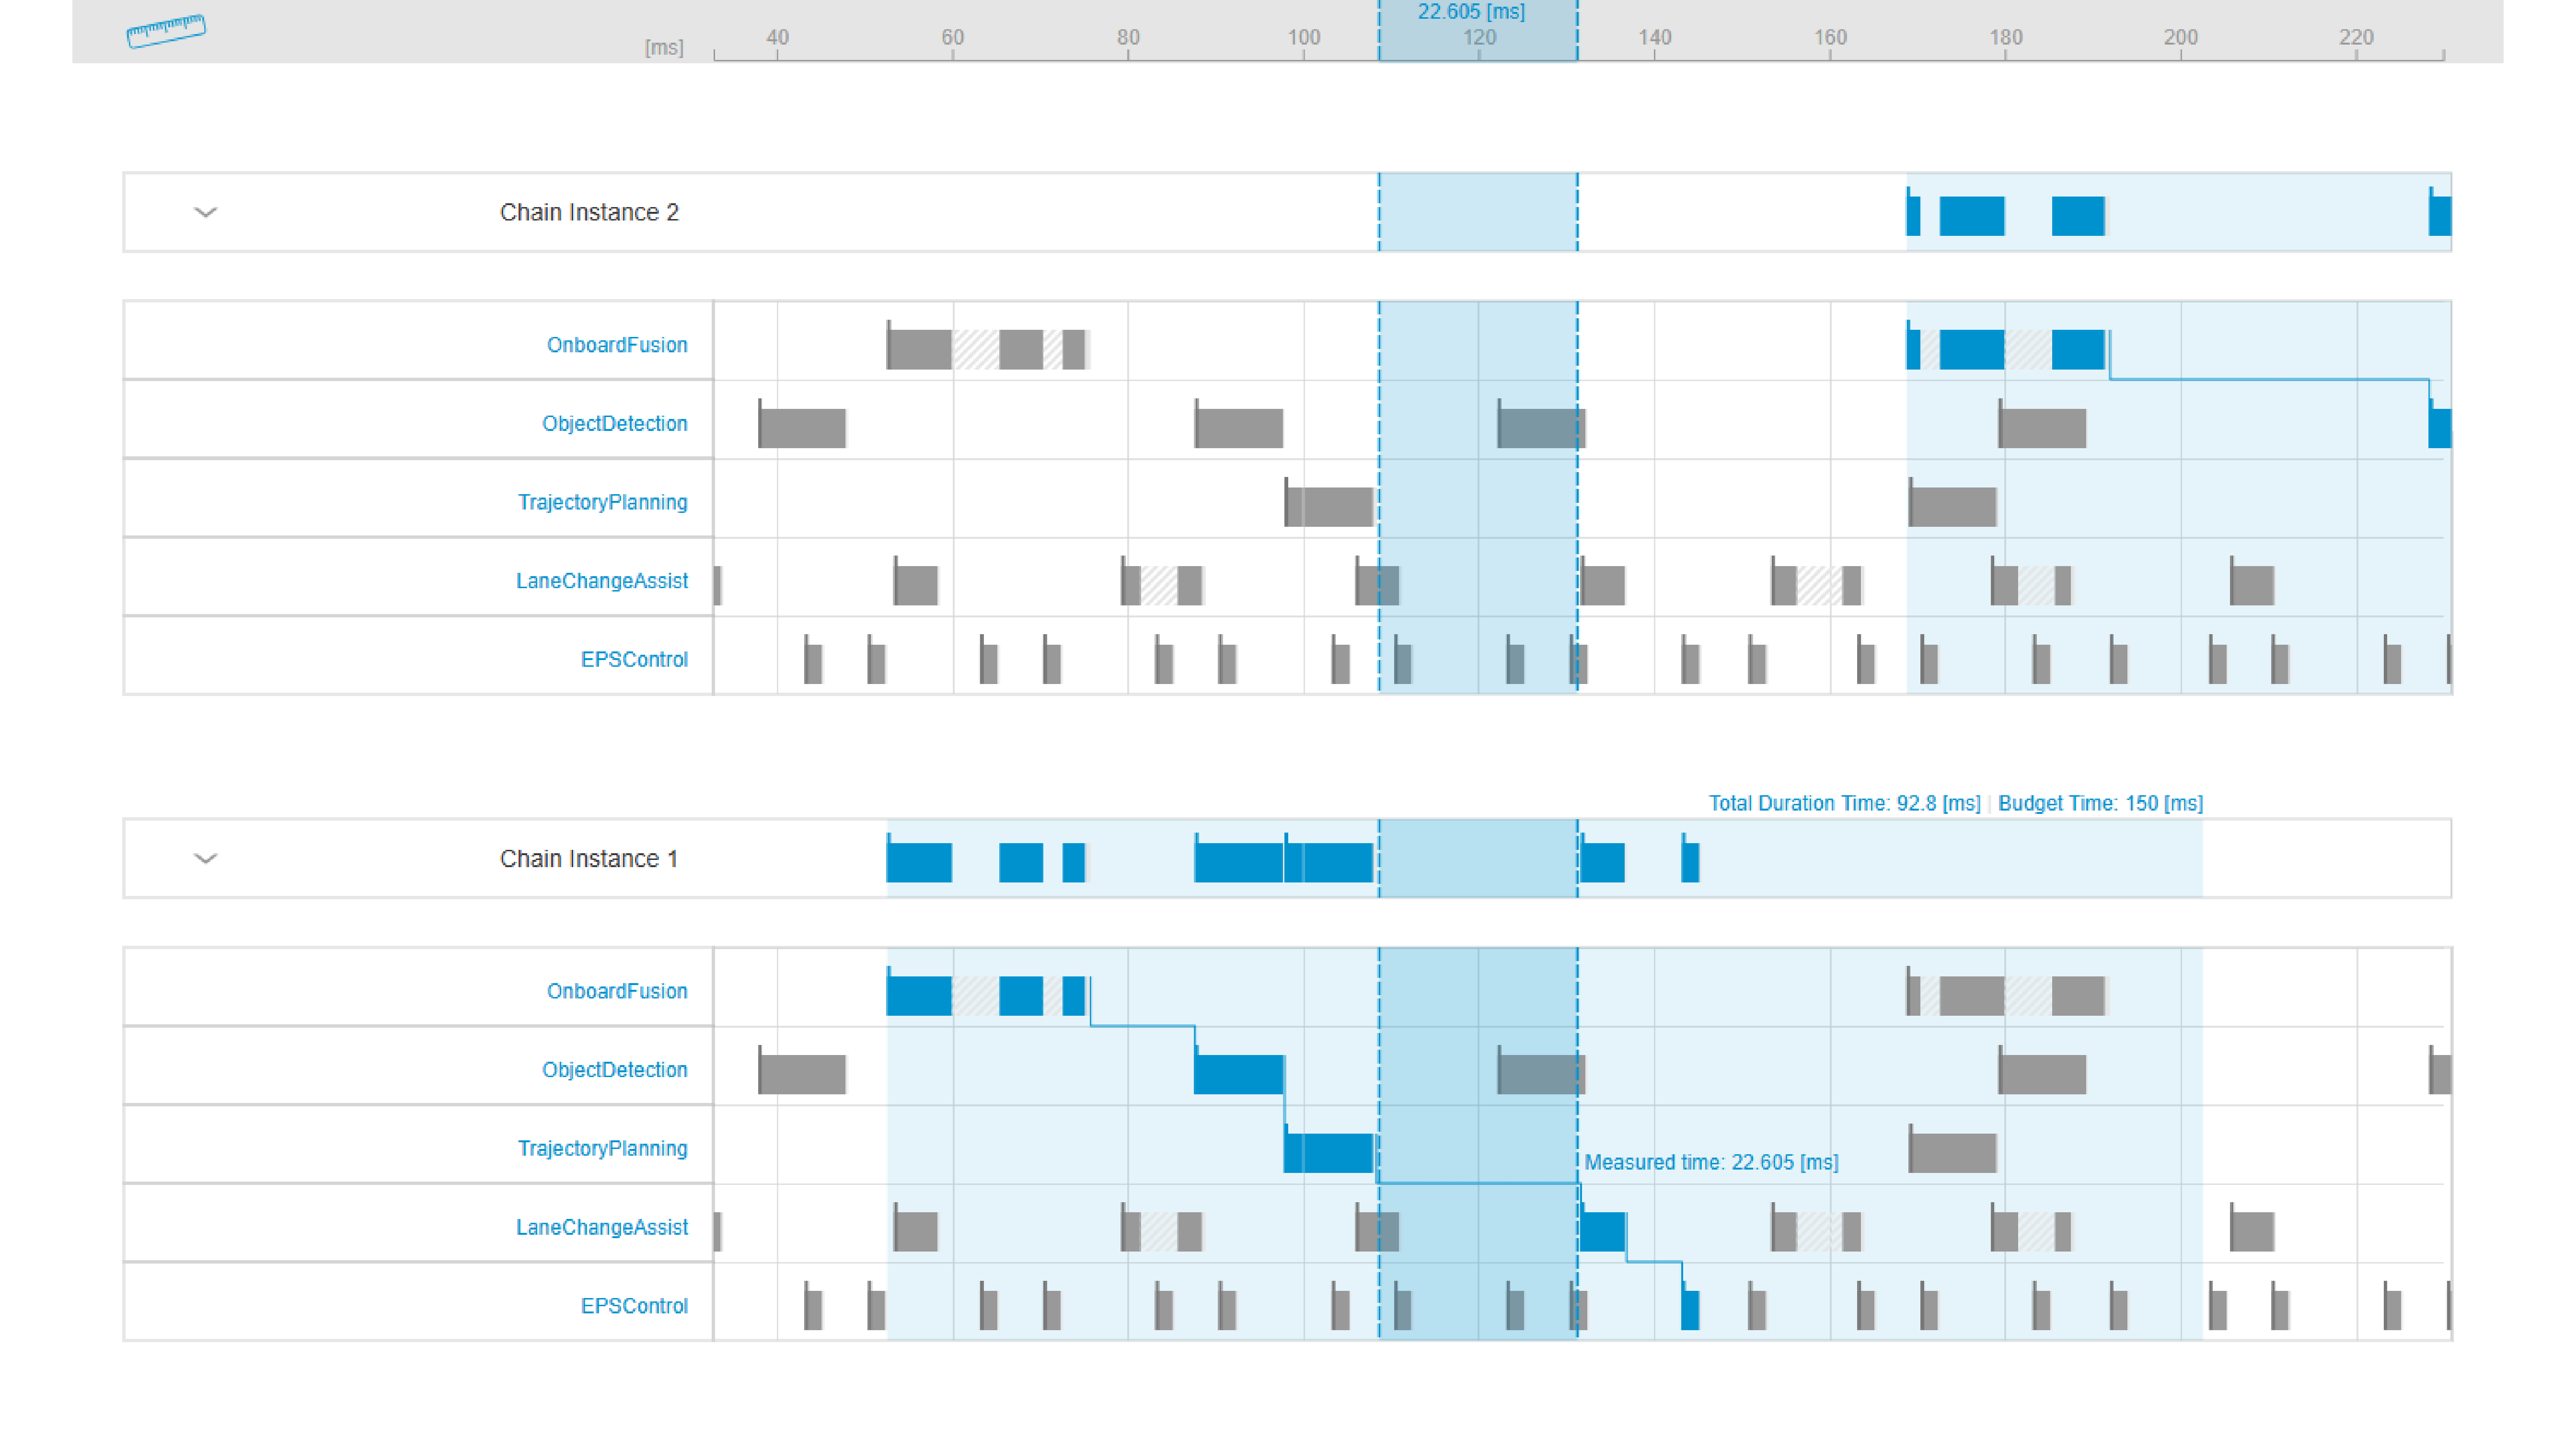
Figure 2: Computation Chains in the planned schedule
Timing Analysis in Data-Flow Driven Execution
Modern automotive systems increasingly rely on data-flow driven scheduling to manage complex computation distributed across multiple cores. In MotionWise Schedule, this is made possible through the Activity Sequencer—a powerful mechanism that orchestrates the execution of activities according to their data dependencies.
With the latest enhancements to the Schedule Viewer, users can now explore the timing of activity sequences directly within the HTML-based visualization:
- For each CPU core involved in executing a sequence, users can observe when the sequence was running and which activities were executed. The timing relative to other periodic tasks can also be analyzed.
- The sequence oriented view with distribution of activities across the CPU cores with input and output dependencies enables the users to perform deeper analysis of the data flow. Furthermore, a new graph view of the sequence with all connections between activities was introduced. This level of granularity helps developers trace the flow of data and understand how each component contributes to overall graph.
By integrating activity sequence insights directly into the Schedule Viewer, MotionWise Schedule provides a unified, intuitive interface for static and runtime analysis of both time-triggered and data-flow driven tasks, making it easier than ever to build robust, responsive systems.
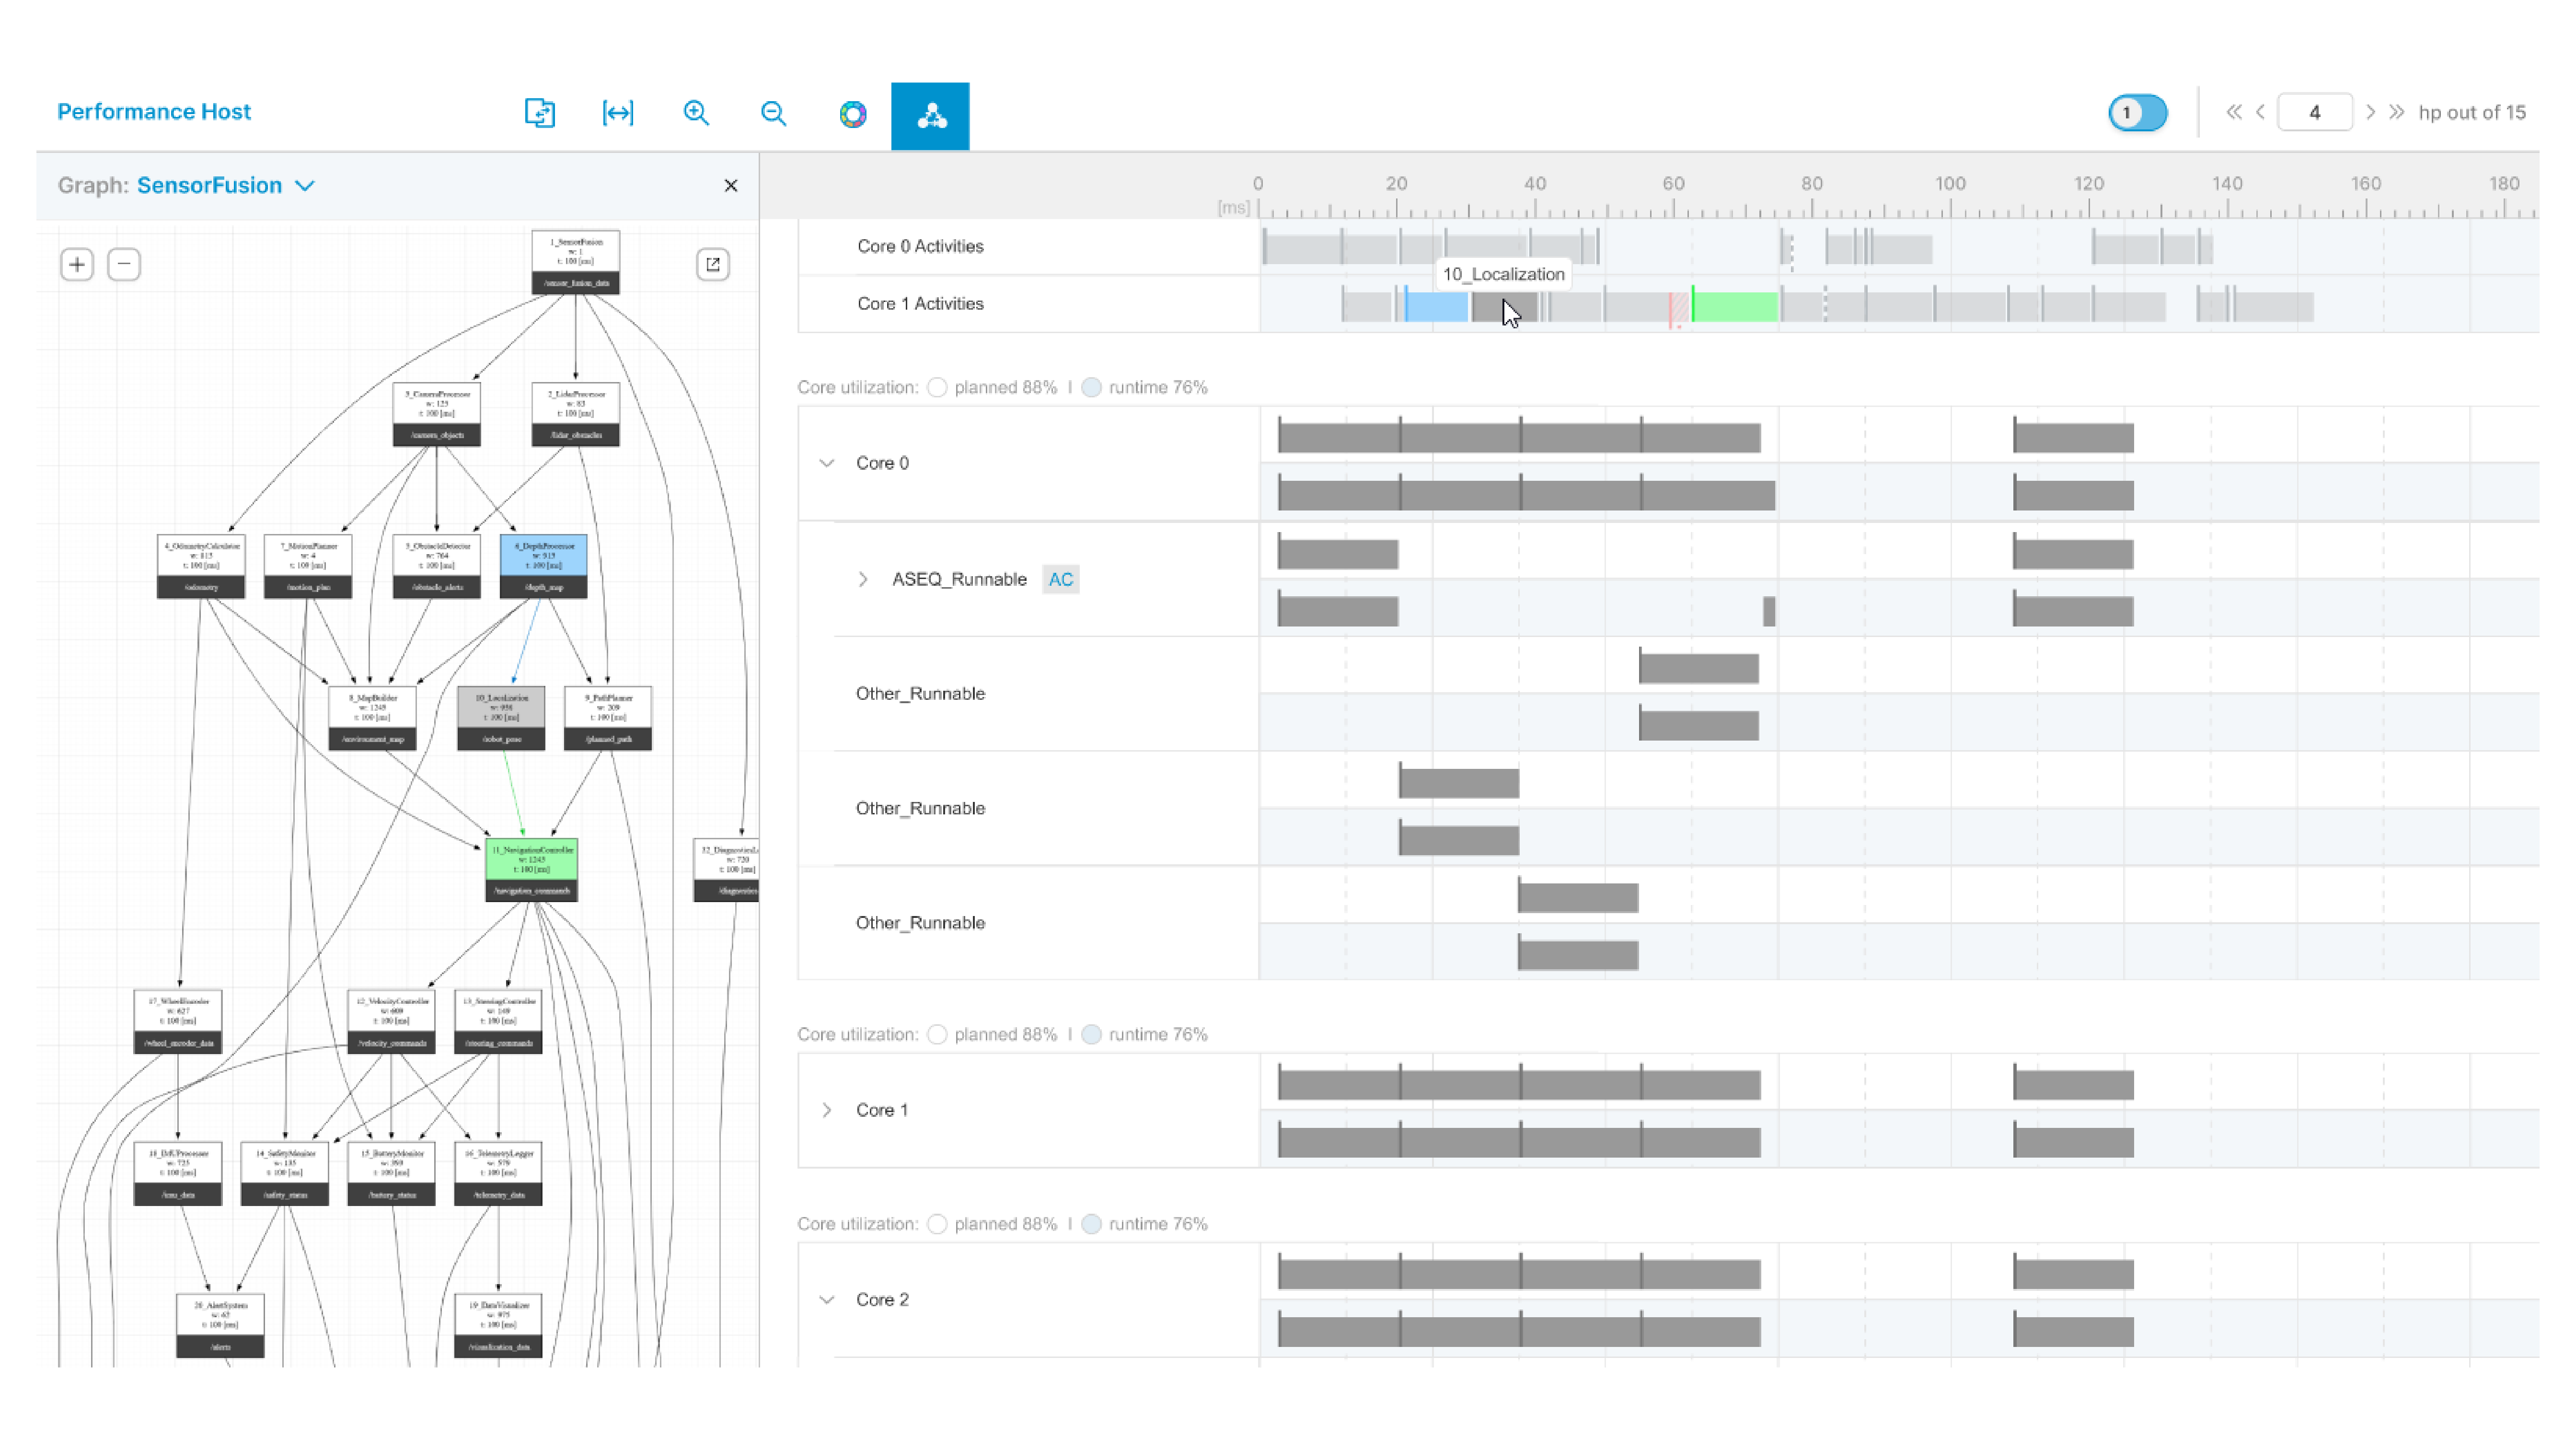
Figure 3: Runtime analysis of data-flow driven applications
How to Use Schedule Visualization in MotionWise
Visualizing your system’s schedule is a powerful way to validate timing, detect anomalies, and ensure runtime behavior aligns with design-time expectations. Here’s a step-by-step overview of how to go from schedule generation to runtime analysis:
- Generate the Schedule – When new applications are added, or some changes are applied on the project, new schedule tables might be necessary. Using MotionWise Creator, this is simple as re-executing the process of schedule generation, which also produces the necessary artifacts for visualization.
- Open the Schedule Viewer - In the output directory, locate the generated HTML file for your SoC (e.g., schedule.html). This file contains a complete, interactive visualization of the planned schedule.
- Explore the Planned Schedule - Use the Schedule Viewer’s built-in tools to observe the results of step #1. This gives you a clear picture of how tasks are distributed across CPU cores and hyperperiods.
- Visualize Computation Chains - Open the companion HTML file for computation chains (e.g., computation_chains.html). This view lets you navigate through defined chains, inspect and validate end-to-end data flow timing.
Planned vs. Actual Execution
Continuing the steps from the previous chapter, step #5 is the import of runtime schedule data and the comparison of planned vs. actual execution. That’s where the Tracepoint Converter (TPC) tool in MotionWise Schedule becomes indispensable.
After generating a planned schedule with MotionWise Creator and running the applications on the target, developers can record real execution timings. But raw trace logs alone don’t tell the full story. The Tracepoint Converter transforms these runtime trace events into a structured format that can be visualized and compared against the planned schedule. This enables development teams to pinpoint deviations, validate timing assumptions, and refine their configurations with confidence.
The process is straightforward: record the runtime traces, convert them using the TPC, and load the resulting JSON into the HTML-based schedule viewer. This visual overlay highlights mismatches between expected and actual behavior—especially valuable when working with the Activity Sequencer or complex computation chains. After loading the resulted JSON file, a second line appears in the tool for each runnable/activity, showing their actual execution on the target.
Whether you're debugging a jitter-sensitive task or validating end-to-end latency across chains, the Tracepoint Converter is your bridge between design-time intent and runtime truth.
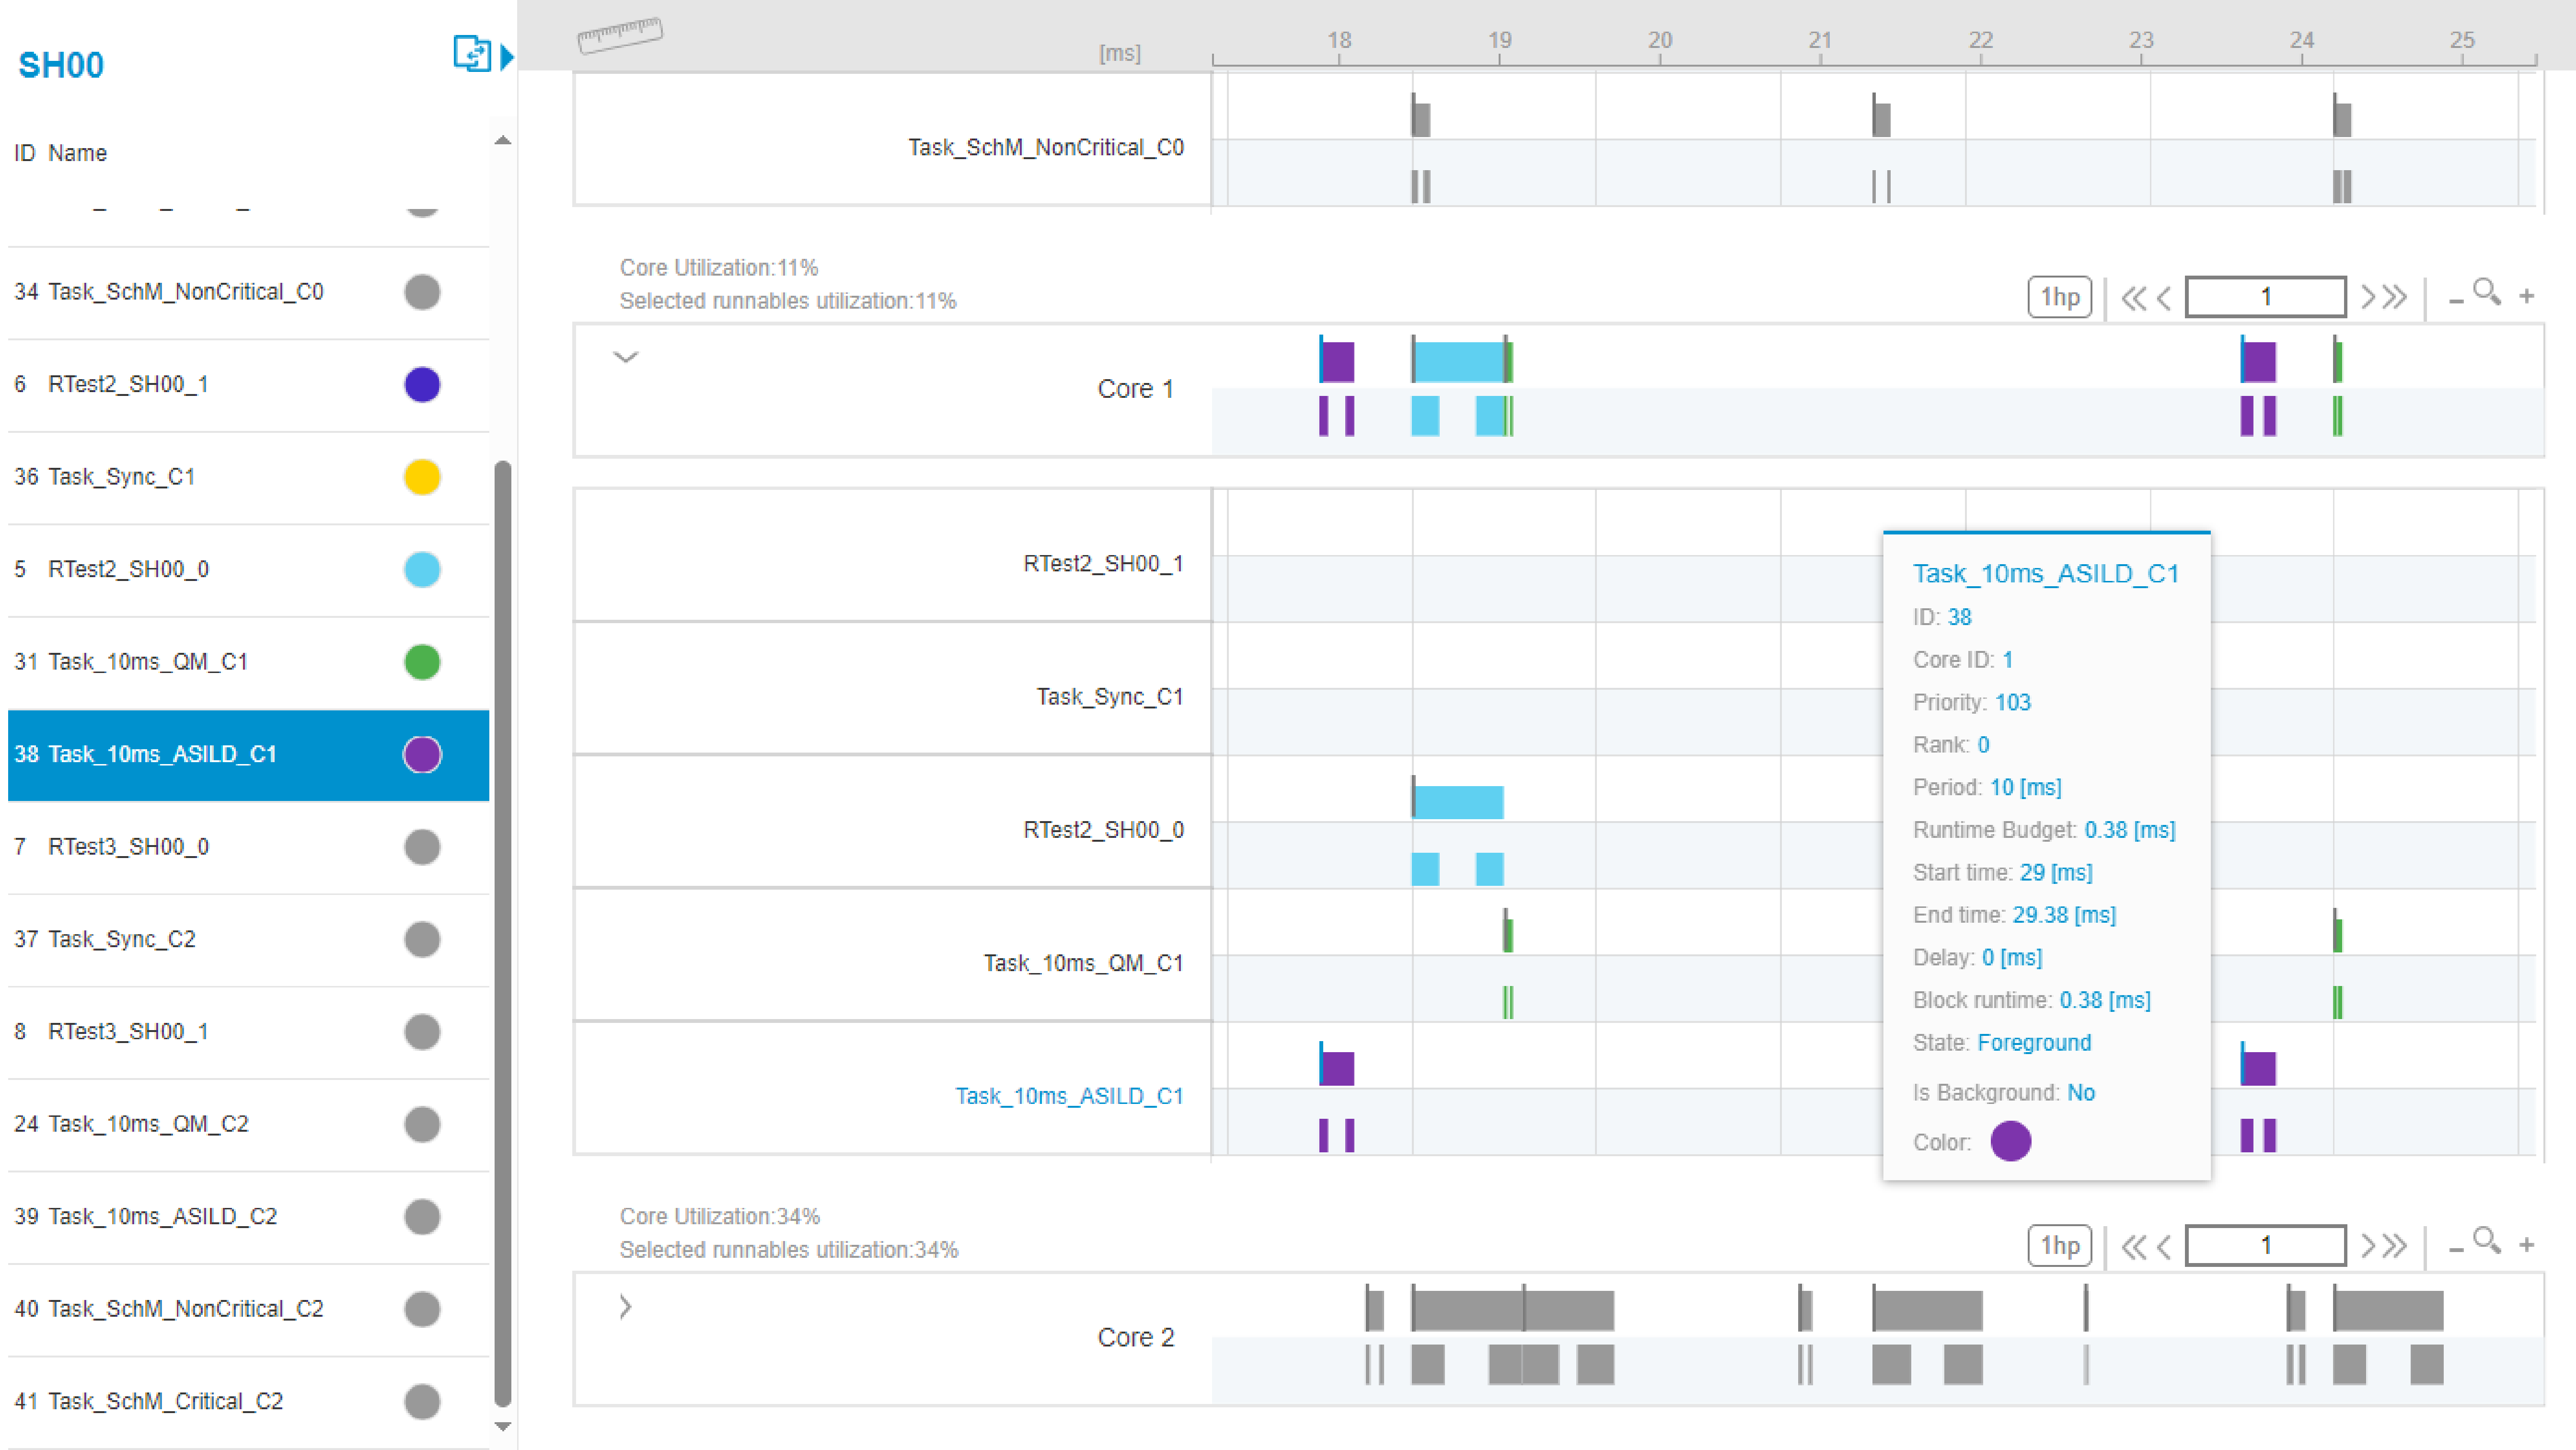
Figure 4: Showing planned vs. actual execution in the Schedule Viewer tool
Conclusion
In safety-critical and real-time systems, timing isn’t just a performance metric — it’s a design constraint. The Schedule Visualization tools of MotionWise Schedule empower teams to bridge the gap between design-time planning and runtime behavior.
By offering a fully interactive, browser-based visualization experience, these tools make it easy to debug a timing issue, validate a new configuration.
In short, MotionWise Schedule transforms complex timing data into actionable insight—empowering developers to build safe, more reliable systems with confidence.